Official Cash Rate
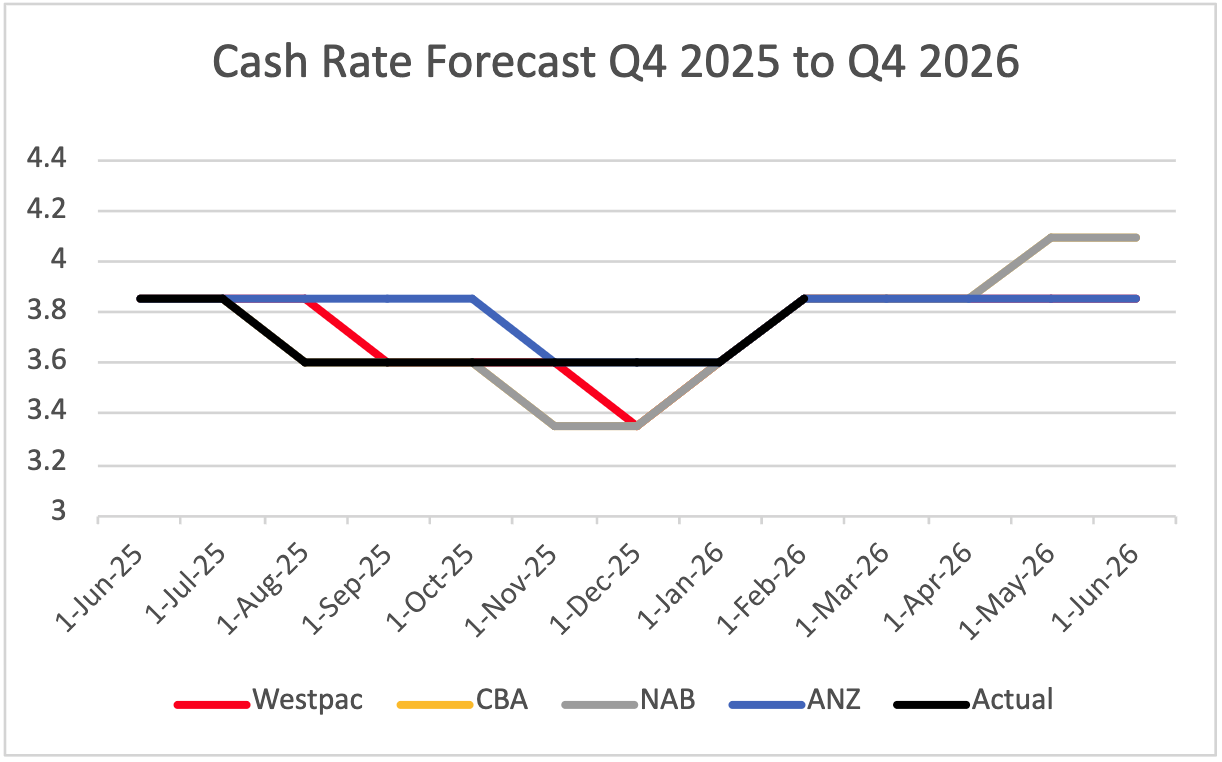
In February 2026, the Reserve Bank of Australia (RBA) increased the cash rate to 3.85%, marking the first increase since November 2023. The increase was driven predominantly by the material pick-up in inflation in the second half of 2025. While certain factors influencing inflation are determined to be temporary, the RBA noted that private demand is growing faster than expected and labour market conditions remain tight. Trimmed mean inflation rose to 3.3% in the 12 months to December 2025, up from 3.2% in the 12 months to November 2025. The Board judged that inflation is likely to remain above target for some time and determined it was appropriate to increase the cash rate on this basis.
Growth in private demand has strengthened substantially more than expected, driven by both household spending and investment, while activity and prices in the housing market are also continuing to pick up. Credit is readily available to both households and businesses, as a result of earlier interest rate reductions. Various indicators suggest that labour market conditions have stabilised in recent months, in line with the pick-up in momentum in economic activity. The unemployment rate has been slightly lower than expected, and measures of labour underutilisation remain at low rates. Growth in the Wage Price Index has eased from its peak, but broader measures of wages growth continue to be strong and growth in unit labour costs remains high.
Ahead of the 3 February meeting, market expectations predicted a rate increase in the lead-up to the RBA’s first meeting of 2026, representing a dramatic shift from earlier expectations of a rate cut. Westpac and ANZ now predict that rates will remain steady in 2026, while CBA and NAB currently predict a rate rise of 25 basis points in May 2026.
Inflation – Consumer Price Index
The Australian Bureau of Statistics (ABS) reported that CPI rose to 3.8% over the 12 months to December 2025, accelerating from 3.4% in November, which had marked a three-month low. This outcome kept underlying inflation above the RBA’s target band of 2–3%. Over the year to December 2025, inflationary pressures were primarily driven by Housing (+5.5%), Education (+5.4%), Alcohol and Tobacco (+4.9%), and Recreation and Culture (+4.4%). Annual Goods inflation was recorded at 3.4% primarily driven by Electricity (+21.5%) whilst Service inflation was 4.1% driven by an increase in rents, holiday travel and accommodation.
In response to the data, the RBA maintained a cautious stance on inflation, a position that ultimately provided further indication for the decision to increase the cash rate in February 2026.
Population
As of June 2025, Australia’s population climbed to 27.61 million, marking an annual increase of 420,100 people, representing a growth rate of 1.5%. This expansion was largely driven by net overseas migration (NOM), contributing 305,600 people, complemented by a natural increase of 114,600.
New South Wales continues to be the most populous state at 8.59 million, followed by Victoria at 7.07 million and Queensland at 5.67 million. Western Australia however has seen the highest growth rate at 2.2% between years, followed by Victoria and Queensland, both recording a 1.8% annual growth rate to June 2025. Major urban centres are seeing the highest growth, while regional areas are experiencing lower yet steady growth rates, slowing from the COVID-19 pandemic regional boom.
Australia’s population growth is a primary driver of housing demand, placing significant upward pressure on property prices and rents, and fuelling demand for both residential and commercial property, expected to stimulate credit activity in real estate financing and infrastructure development.
Employment
As of December 2025, Australia’s labour market remained relatively resilient, with the unemployment rate declining to 4.2% and total employment rising to 14.686 million. The employment-to-population ratio held steady at 64.0%, while the labour force participation rate remained unchanged at 66.8%, indicating stable engagement in the workforce. On a seasonal basis, the underemployment rate returned to levels seen last quarter at 5.7% and total monthly hours increased to 2,001 million, indicating the easing of spare capacity in the labour market.
At a state level, New South Wales recorded an unemployment rate of 4.0%, below the national average, whilst Victoria came in at 4.7%, representing the highest rate across the country. Over the year, full time employment increased by 165,400 signalling a shift to more stable employment.
Dwelling Approvals
Building approvals for 2025 totalled approximately 195,000, up over 12% from 173,000 in 2024. Unit approvals are emerging, with the 6-month average now 6% above the decade average, while house approvals have seen a more modest trend, holding 3.2% below their average levels. Total dwelling approvals for the month of December 2025 totalled 15,542, a 14.9% decrease from the 18,406 approvals in November 2025. The November 2025 jump was spurred by a 36% surge in the unit sector. Private sector house approvals rose 0.4% to 9,487 in December 2025, while private sector non-house dwellings fell 29.8% to 5,855. Dwelling approvals were down across most states for the month of December 2025, with Tasmania being the only state to record a rise at 11.3%.
The variance between November and December 2025 approvals however, highlights the stop-start reality for apartment approvals, with approvals for nine storeys and above down 43%, and approvals for four storeys and above down 37%. The Property Council of Australia highlighted the need for steadier approvals at scale, and faster conversion from approval to construction.
The value of total building work approved fell 12.3% (to $16.32 billion), after a 12.9% rise in November. The value of total residential building fell 16.0% (to $9.49 billion), comprised of a 17.8% fall in new residential value and a 1.4% fall in alterations and additions. The value of approved non-residential building fell 6.4% (to $6.83 billion), after a 1.8% November fall.
Both the volume and value of new home loan commitments saw a rise in value of new financing, with residential mortgage commitments reaching its highest level at $98 billion for the September 2025 quarter.
The ABS data shows that annual approvals have increased, however Property Council Group Executive, Matthew Kandelaars noted that national targets won’t be hit through monthly surges only, emphasising the need for a consistent pipeline of feasible projects that can move from approval to site. Approvals for apartment buildings nine storeys and above rose 24% in 2025 compared to 2024, while approvals for apartment buildings four storeys and above rose 37%. Matthew Kandelaars commented on the delays to projects following approvals, including utilities connections, servicing upgrades, certification, subdivision and titling, and infrastructure sequencing. Improvements to these delays will assist in making apartment projects more viable for developers.
Median Dwelling Price
As of December 2025, the Australian housing market has continued to stabilise, entering a sustained upward trajectory. National median dwelling values rose 2.8% over the quarter, driven by a 2.7% increase across the combined capital cities and a 3.5% lift in regional markets. Sydney remained the country’s most expensive market, although values dropped 0.1% from their November peak. Melbourne also recorded a 0.1% monthly decline, placing its dwelling values 0.9% below the record levels reached in March 2022.
In contrast, Brisbane (+1.6%), Adelaide (+1.9%), Perth (+1.9%) and Darwin (+1.6%) all posted monthly gains, each reaching new record highs. Hobart (+0.9%) and Canberra (+0.2%) also saw modest month-on-month increases; however, both remain below the highs recorded in the first half of 2022, with Hobart down 5.4% and Canberra down 2.1%
The total value of Australia’s residential housing market rose to $12.3 trillion in the December quarter, encompassing 11.4 million dwellings nationwide and an average price of $1.045 million. Persistently rising land prices continue to influence buyer behaviour, redirecting demand toward more affordable regions and away from high-cost metropolitan centres such as Sydney.
Vacancy Rates
Vacancy rates tightened over 2025, remaining well below the pre-COVID decade average of 3.3%. Vacancy rates reduced from 2.1% in December 2024 to 1.7% in December 2025, ultimately accelerating rental growth. Rental supply is a major factor influencing vacancy rates, with rental listings in Q4 2025 roughly 11% lower than Q4 2024, and 17% down on the previous five-year average. Interestingly, rental vacancy rates were lower across regional Australia at 1.7% while the combined capitals recorded a 1.8% vacancy rate.
House Rental Rates
Australia’s rental market remained under sustained pressure in December 2025, with national rents rising 1.3% over the quarter, up from 0.9% in Q3. Annual rental growth lifted to 5.2% in 2025, compared with 4.8% in 2024, reflecting persistently tight supply. National rental listings were 11% lower than a year earlier and 17% below the five‑year average.
Sydney retained its position as the country’s most expensive capital, with a median weekly rent of $817; $855 for houses and $758 for units, delivering an average yield of 3.0%. Hobart remained the most affordable capital at $601 per week, with houses at $619 and units at $529, generating an average yield of 4.3%.
Despite solid rental demand, rental growth lagged property prices, compressing the national gross rental yield to 3.56% – its lowest level since September 2022. Regional markets outperformed capitals, recording 6.2% annual rental growth versus 4.8% across the combined capitals. Darwin posted the strongest annual increase at 8.2%, while Melbourne recorded the weakest at 2.9%.